

Quantifying UX Project
This quantitative study analyzed pre-existing medical imaging usability data using descriptive and inferential statistics to evaluate clinician performance, workload, and usability across two breast cancer screening interfaces, uncovering key insights.
Class Project: Quantifying User Experience
Duration: 2 months (March 2025-April 2025)
Tools Used: JASP, Microsoft Excel, Figma Slides
Team Roles: Team Lead / UX Researcher
Project Overview
Purpose: Determine how clinician experience, workload, usability, and efficiency differ between single- and multi-modality breast cancer screening interfaces.
Target Audience:
Breast cancer screening clinicians
Healthcare UX and product teams
Scope: Analyzed pre-existing user study data comparing workload (NASA TLX), usability (SUS), and time on task across interface types and clinician experience levels.
Analysis Techniques:
Descriptive statistics
Independent and paired t-tests
ANOVA and correlation analysis
Data visualization
Role:
Served as UX Researcher and team lead
Responsible for workload analysis across clinician groups
Coordinated meetings, task planning, timelines, and team workflow
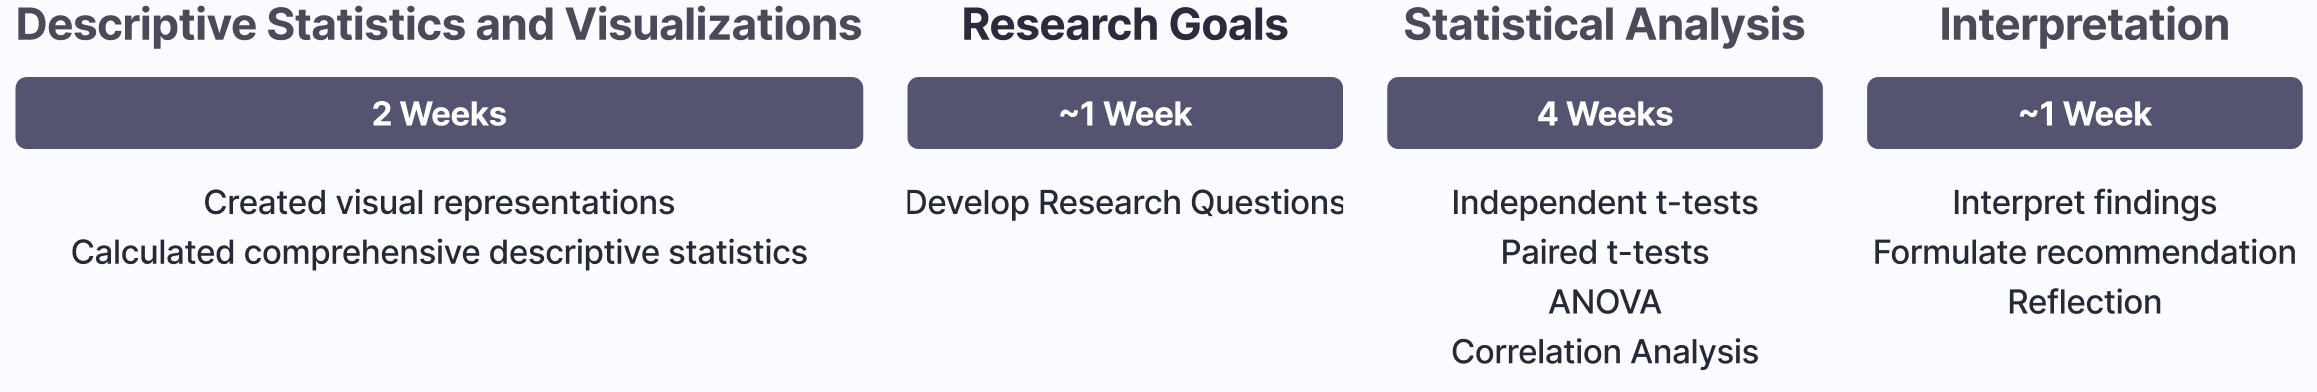
Project Timeline
Data Overview
Description of Data
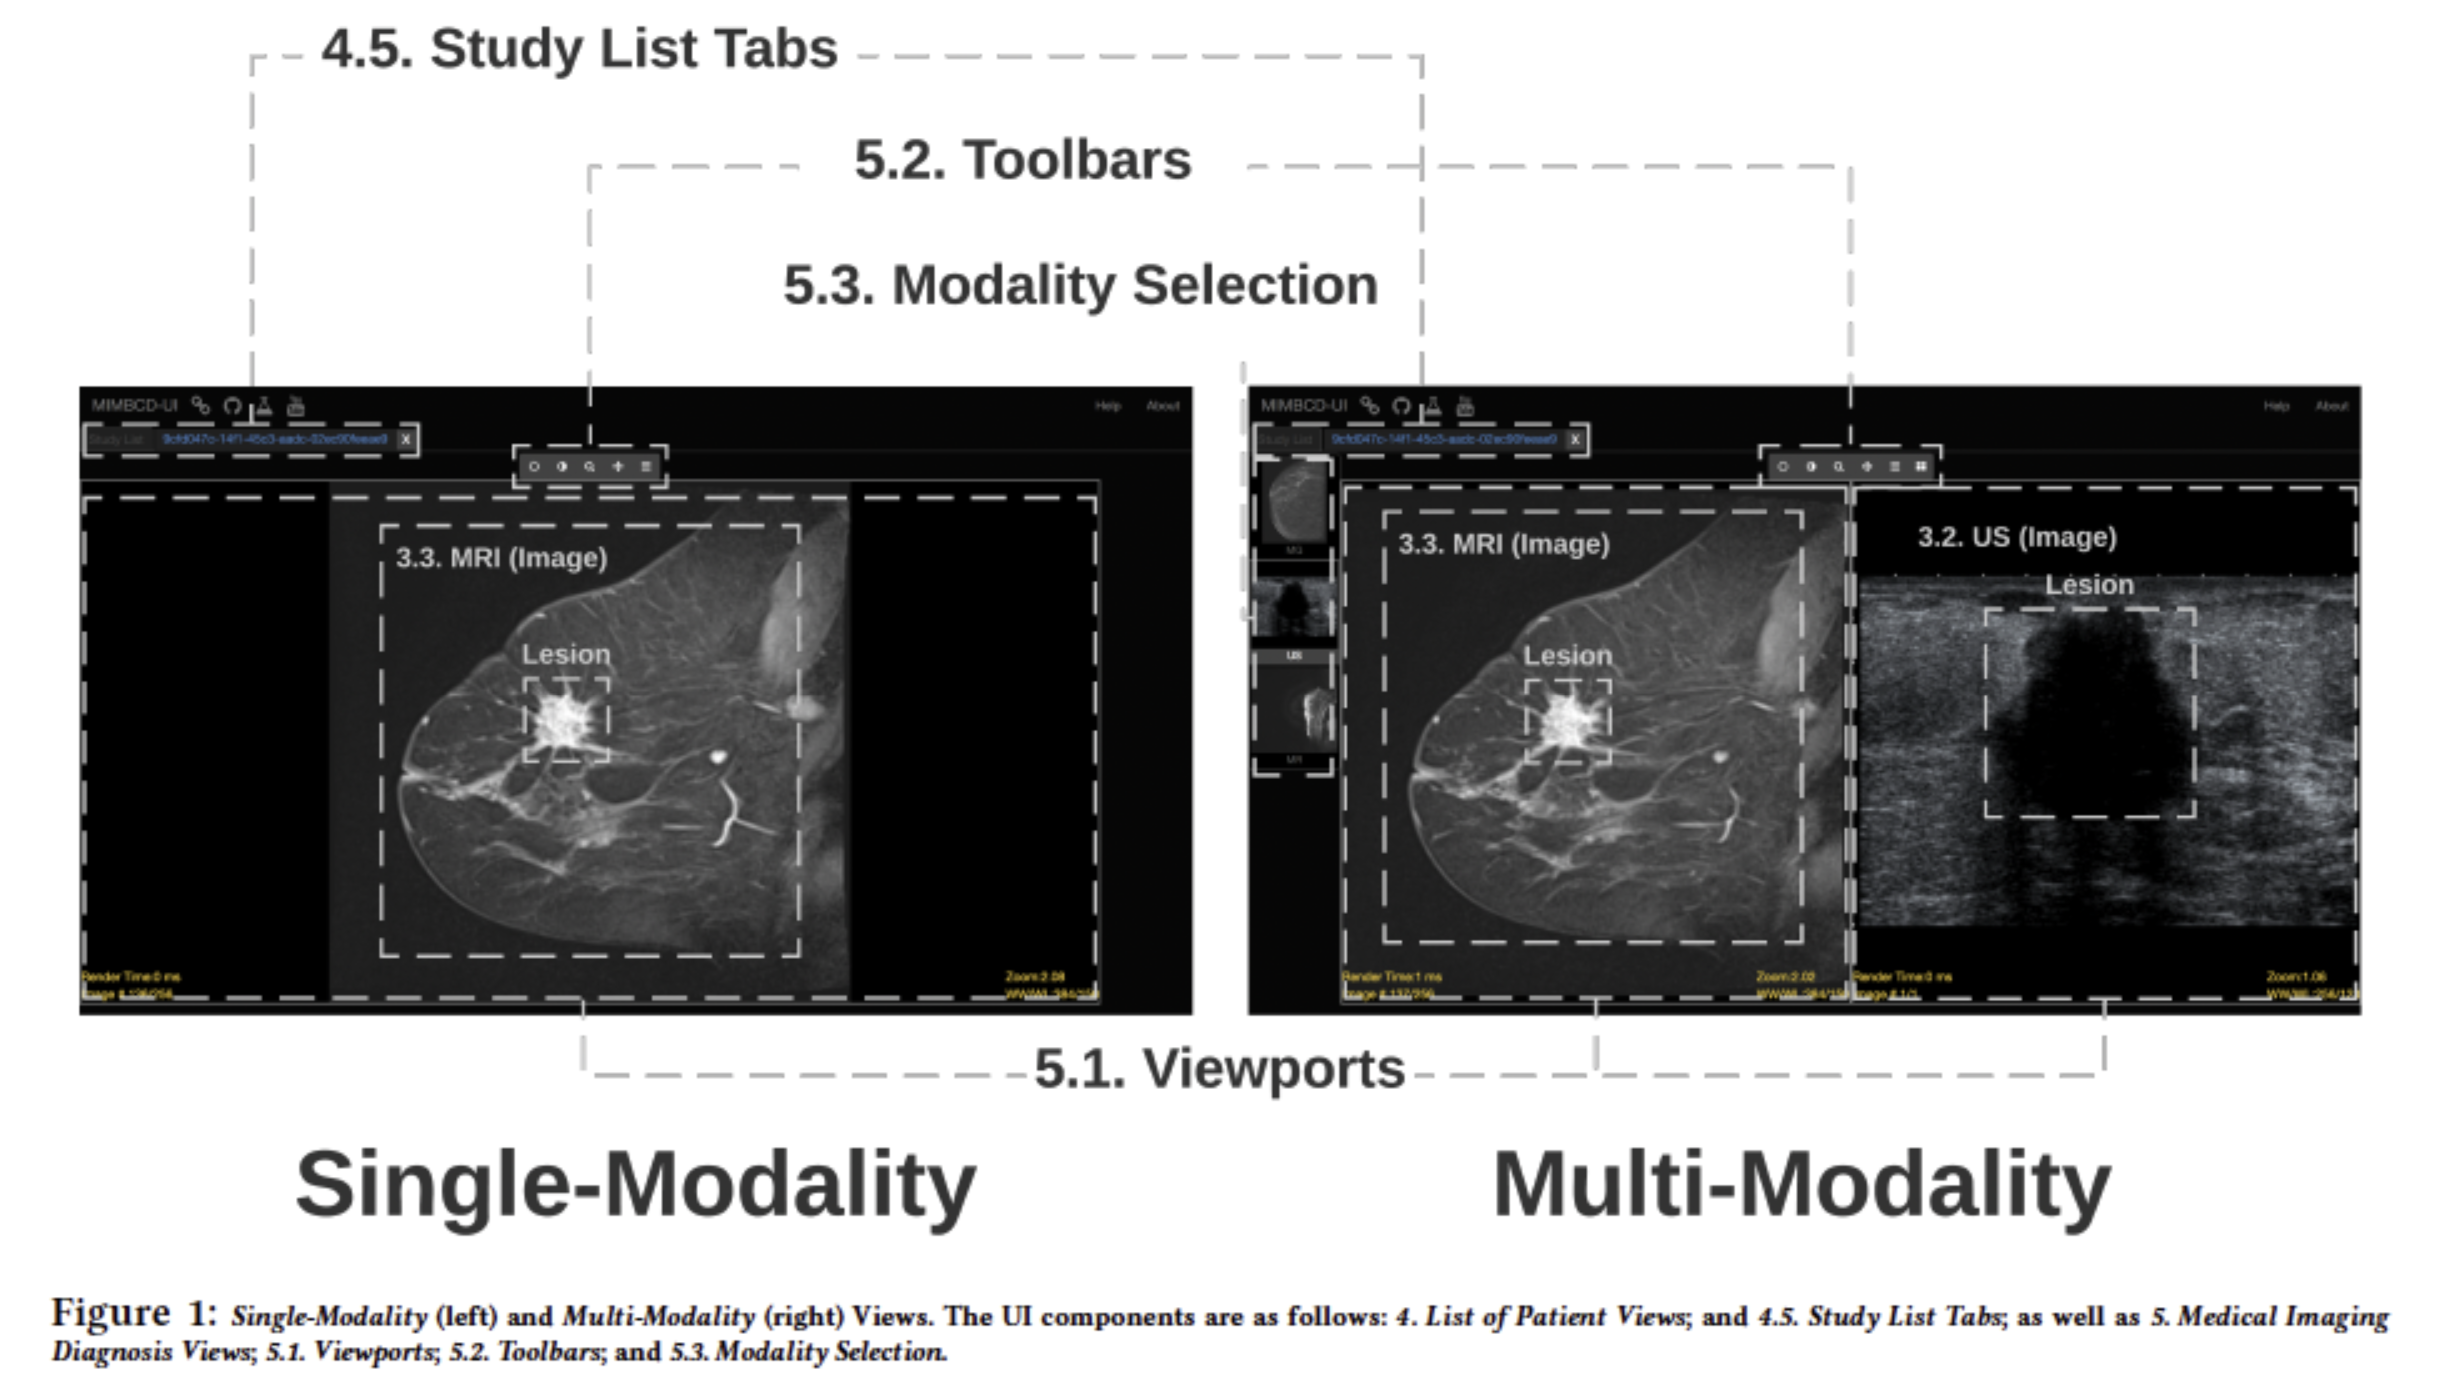
The dataset came from an A/B test of a medical imaging application comparing a single-modality (S) and multi-modality (M) interface. Thirty-one clinicians across experience levels completed breast cancer screening tasks.
Three dependent variables were measured:
NASA Task Load Index (TLX): Captured perceived workload across six dimensions, with overall workload calculated by averaging raw scores across all subscales.
System Usability Scale (SUS): A 10-item survey measuring perceived usability, completed after the usability test.
Time on Task: Measures how long users took to complete the task, indicating efficiency.
For the purposes of our study, clinicians were grouped by experience: Group 1 (intern/junior, n = 12) and Group 2 (middle/senior, n = 19).
Terminology
G1 - Group 1 of clinicians (intern & junior)
G2 - Group 2 of clinicians (middle & senior)
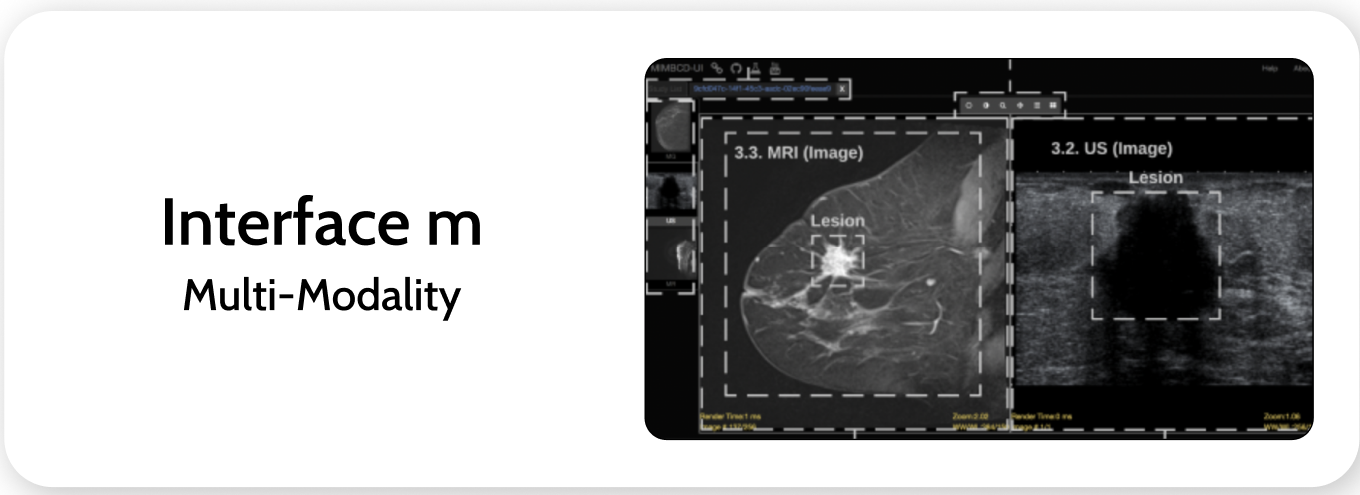
Interface s or “s” - Single Modality Interface
Interface m or “m” - Multi Modality Interface
G1s - Group 1 of clinicians (interns & juniors) using interface “s” (single modality)
G2s - Group 2 of clinicians (middle & senior) using interface “s” (single modality)
G1m - Group 1 of clinicians (interns & juniors) using interface “m” (multi modality)
G2m - Group 2 of clinicians (middle & senior) using interface “m” (multi modality)
Research
We focused our research on 5 main questions:
How do average workload scores differ by clinician group?
Is there any correlation between variables?
Is one interface perceived as more usable overall?
Is efficiency (TOT) affected by clinician experience?
Is there a difference between these interfaces?
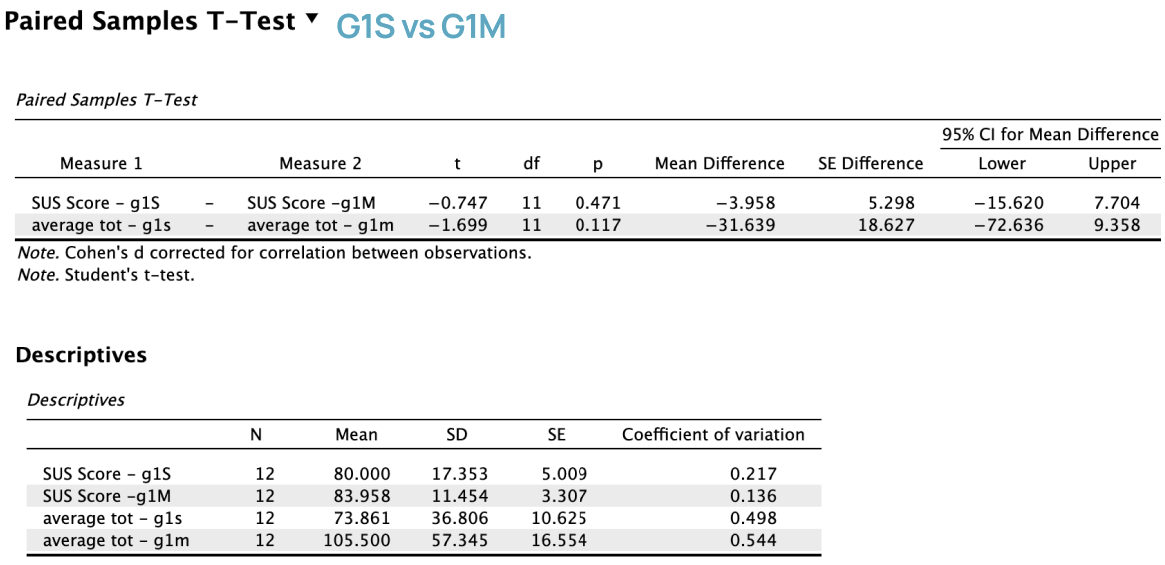
Q1. How do average workload scores differ by clinician group? (my main focus)
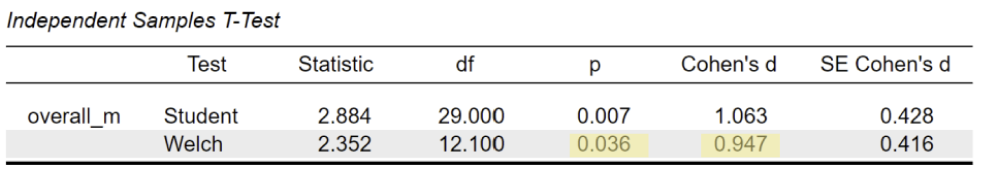
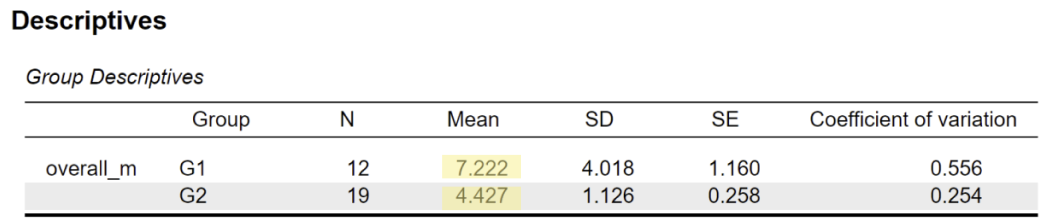
An independent t-test compared NASA TLX workload scores between Group 1 and Group 2 for the single-modality interface.
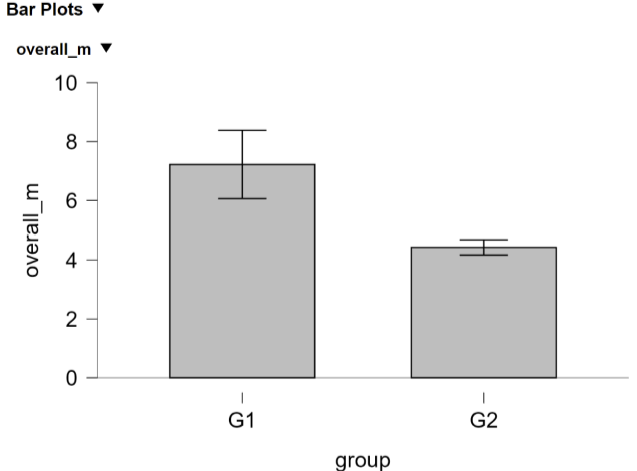
*Note: Results for the multi-modality interface were not statistically significant and are excluded.
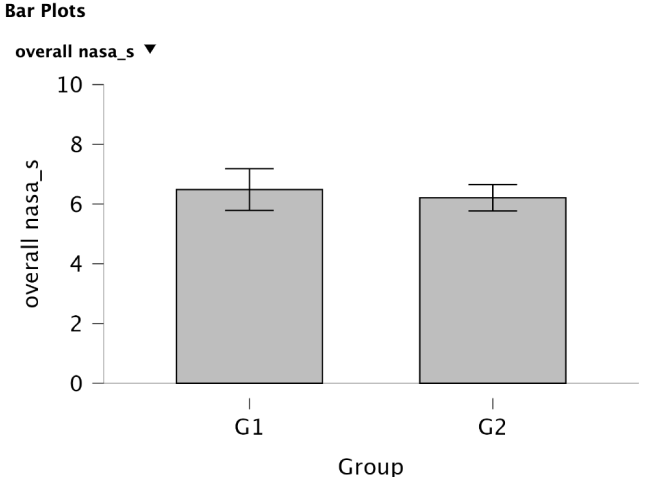
Single-modality:
Multi-modality:
This difference was statistically significant (t = 2.35, p = .036), indicating that clinician experience level plays a role in perceived workload.
On average, junior/intern clinicians (G1) reported higher workload scores compared to mid/senior clinicians (G2).
The effect size was large, d = 0.95, further indicating that G1 clinicians experienced substantially higher workload than the more experienced G2 clinicians.
Interpretation:
Less experienced clinicians may find the system more cognitively or physically demanding, possibly due to less familiarity with clinical tasks or digital interfaces.
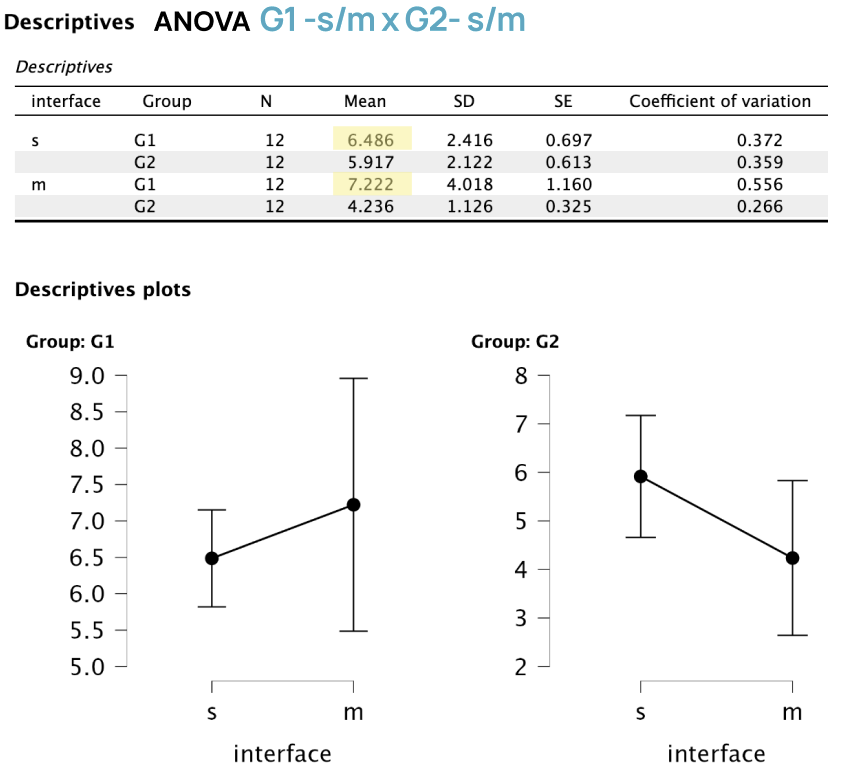
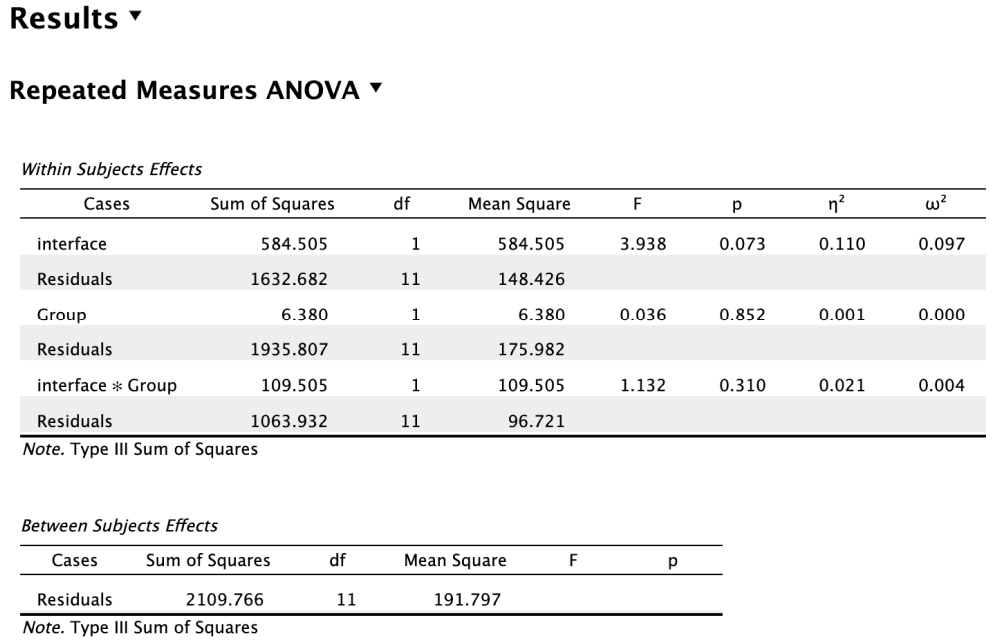
To further explore this, we conducted an ANOVA to examine whether perceived workload differed by interface type, clinician group, and their interaction, followed by post-hoc analyses.
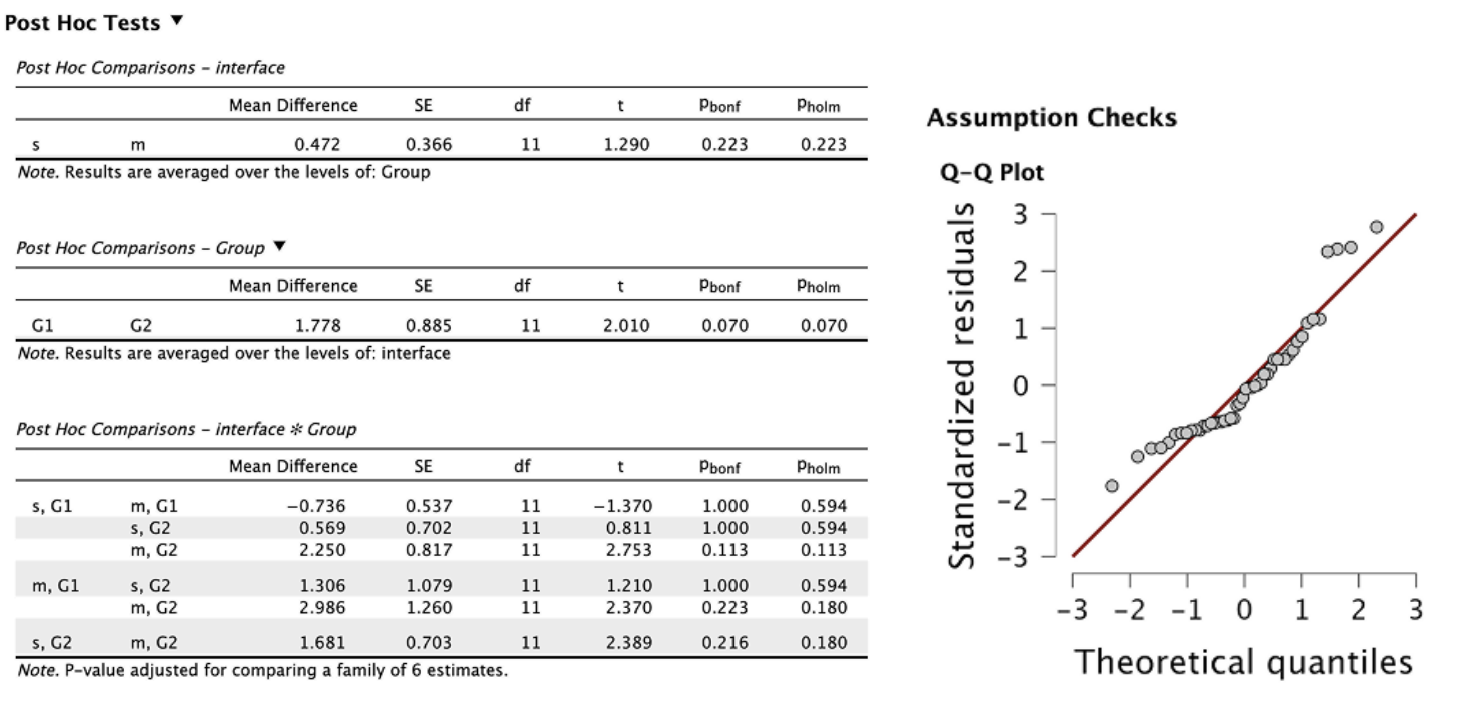
There's no overall difference in workload between the single and multi-modality devices (p = .223).
Junior clinicians may report slightly higher workload than seniors, but it’s not quite significant (p = .070).
Statistically significant (p = .036): The effect of device type on workload depends on clinician group.
G1: Workload actually increased with the multi-modality device.
G2: Workload decreased with the multi-modality device.
Model assumptions were met, and post-hoc analyses supported the overall ANOVA trend, reinforcing the influence of experience level on perceived workload.
Interpretation:
Clinician experience level influences how users perceive the workload of the multi-modality interface.
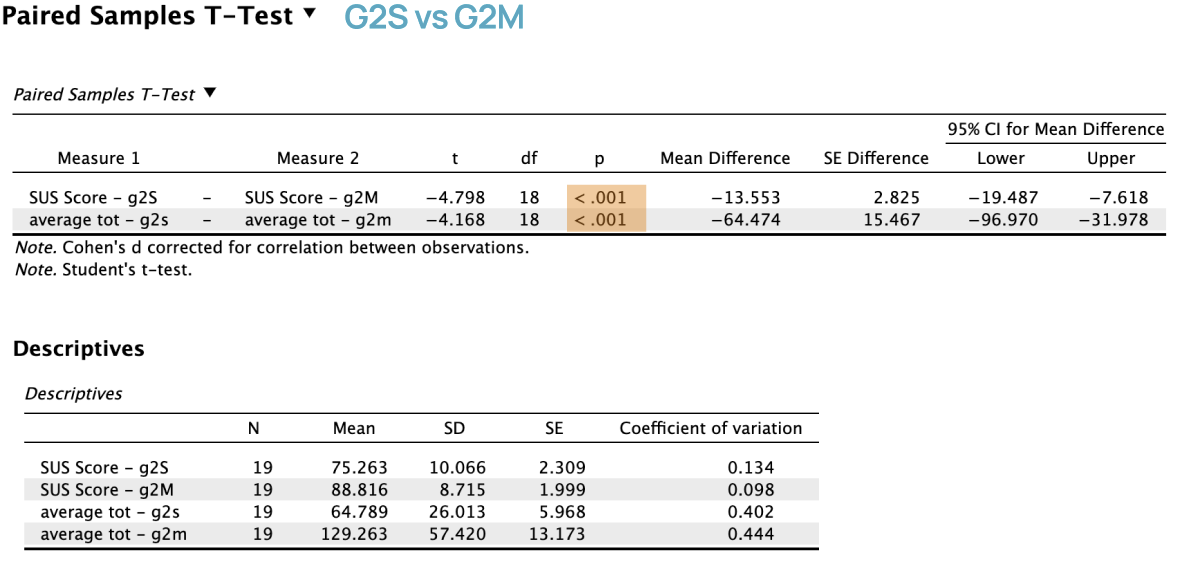
Q2. Is there any correlation between variables?
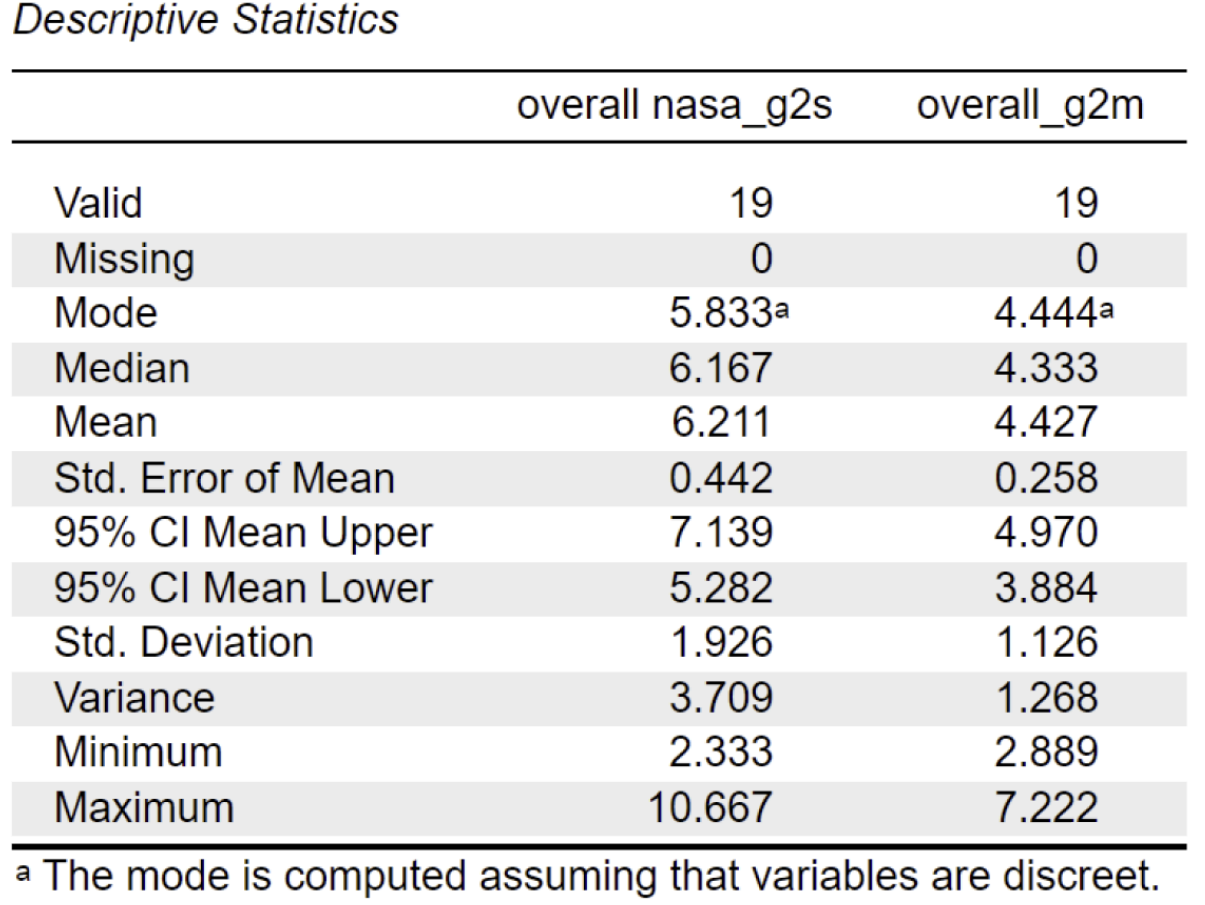
For G2 (middle/senior clinicians), the overall NASA-TLX workload score was lower on Interface M compared to Interface S
M: (mean = 4.43, sd = 1.13)
S: (mean = 6.21, sd = 1.93)
This suggests that Interface M felt less cognitively demanding for more experienced users.
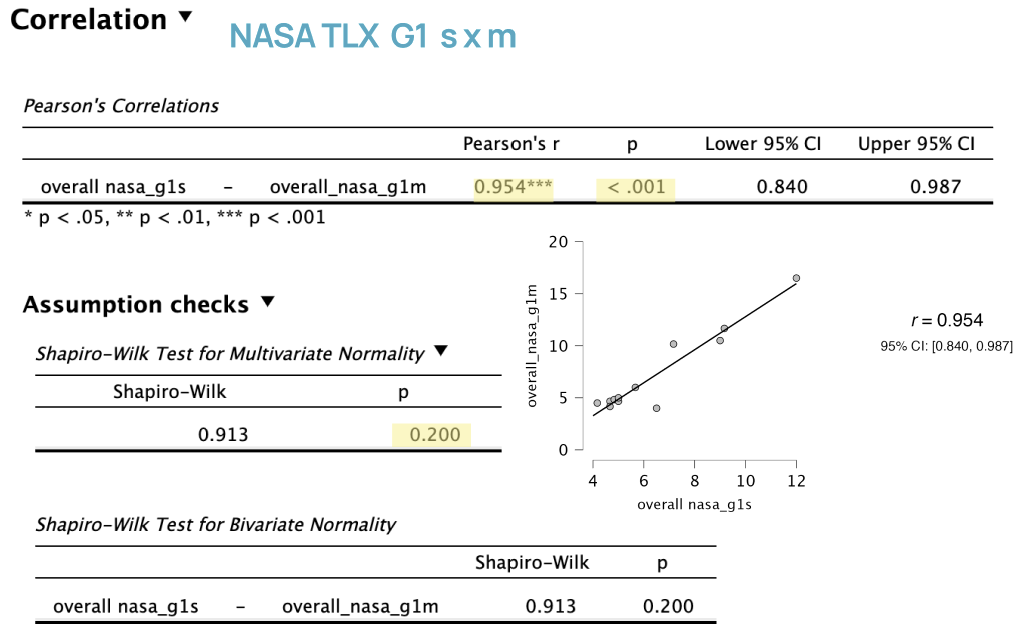
Strong Positive Correlation:
Pearson’s r = 0.954 shows a very strong positive correlation between workload scores for single- and multi-modality devices among intern and junior clinicians.
Statistical Significance:
p < .001 and the confidence interval does not include 0, indicating the correlation is statistically significant.
Workload Comparison:
Group 1 (intern and junior clinicians) had a higher total average NASA TLX score across both single- and multi-modality interfaces compared to Group 2.
ANOVA:
The test shows higher means for G1 in both single and multi- modality
Interpretation:
Clinicians in Group 1 who reported higher workload on one device also reported higher workload on the other, and overall experienced greater workload than Group 2, suggesting both devices were more demanding for less experienced clinicians.
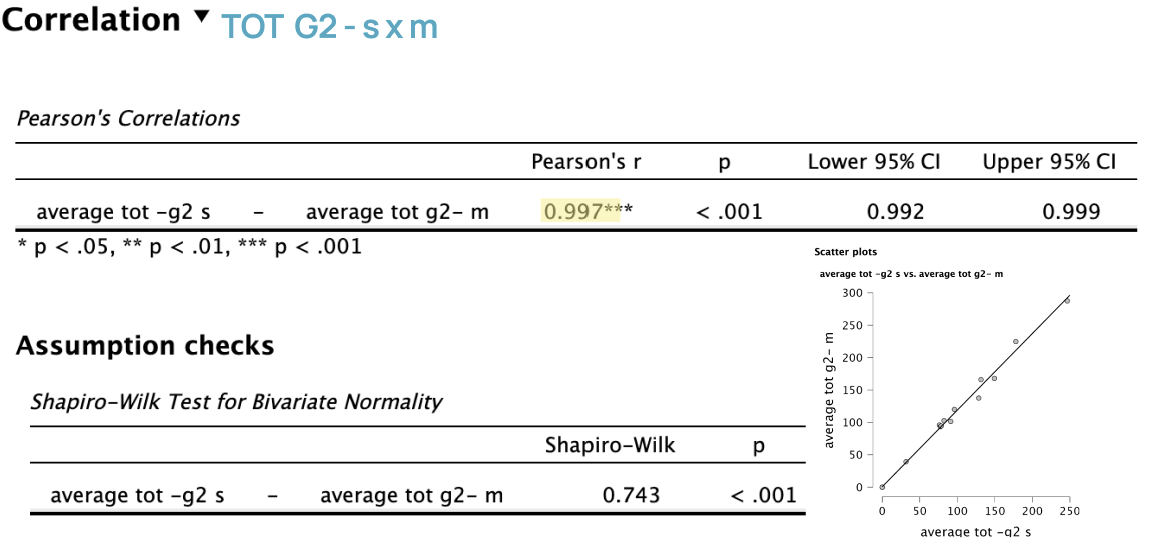
Next, we ran correlation analyses for G1 and G2 clinicians comparing time on task across interfaces.
*Note: Additional correlations between NASA TLX and SUS were tested but showed no significant results and are excluded.
Results are shown below:
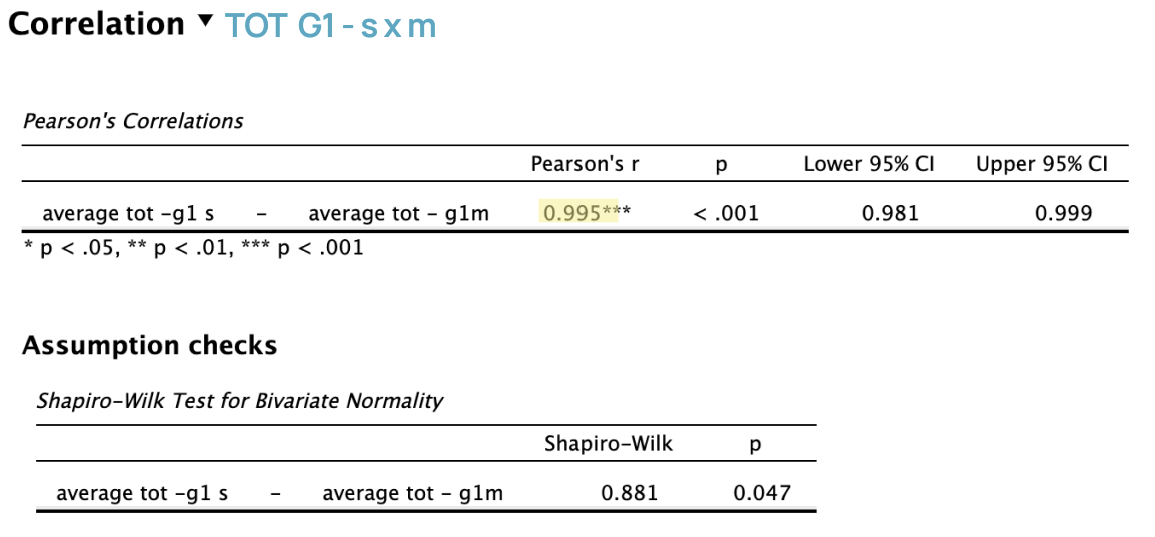
Intern & Junior Level Clinicians:
Pearson’s r = 0.995 shows a very strong positive correlation.
Lower-level clinicians showed similar ToT patterns across both devices.
p < .001 and confidence interval between 98% and 99% (excluding 0) indicates correlation is statistically significant.
Middle & Senior Level Clinicians:
Pearson’s r = 0.997 indicates a very strong positive correlation.
p < .001 and 99% confidence interval (excluding 0) indicates correlation is statistically significant.
Interpretation:
Across both experience levels, time spent on one interface was highly predictive of time spent on the other.
This consistency suggests that users’ performance patterns were not dependent on interface type.
After calculating descriptive statistics, we ran a correlation analysis to examine workload across interfaces, followed by ANOVA to test differences by interface type, clinician group, and their interaction.
*Note: Correlation results for middle/senior clinicians (G2) were not statistically significant and are excluded.
Results are shown below:
Q3. Is one interface perceived as more usable overall?
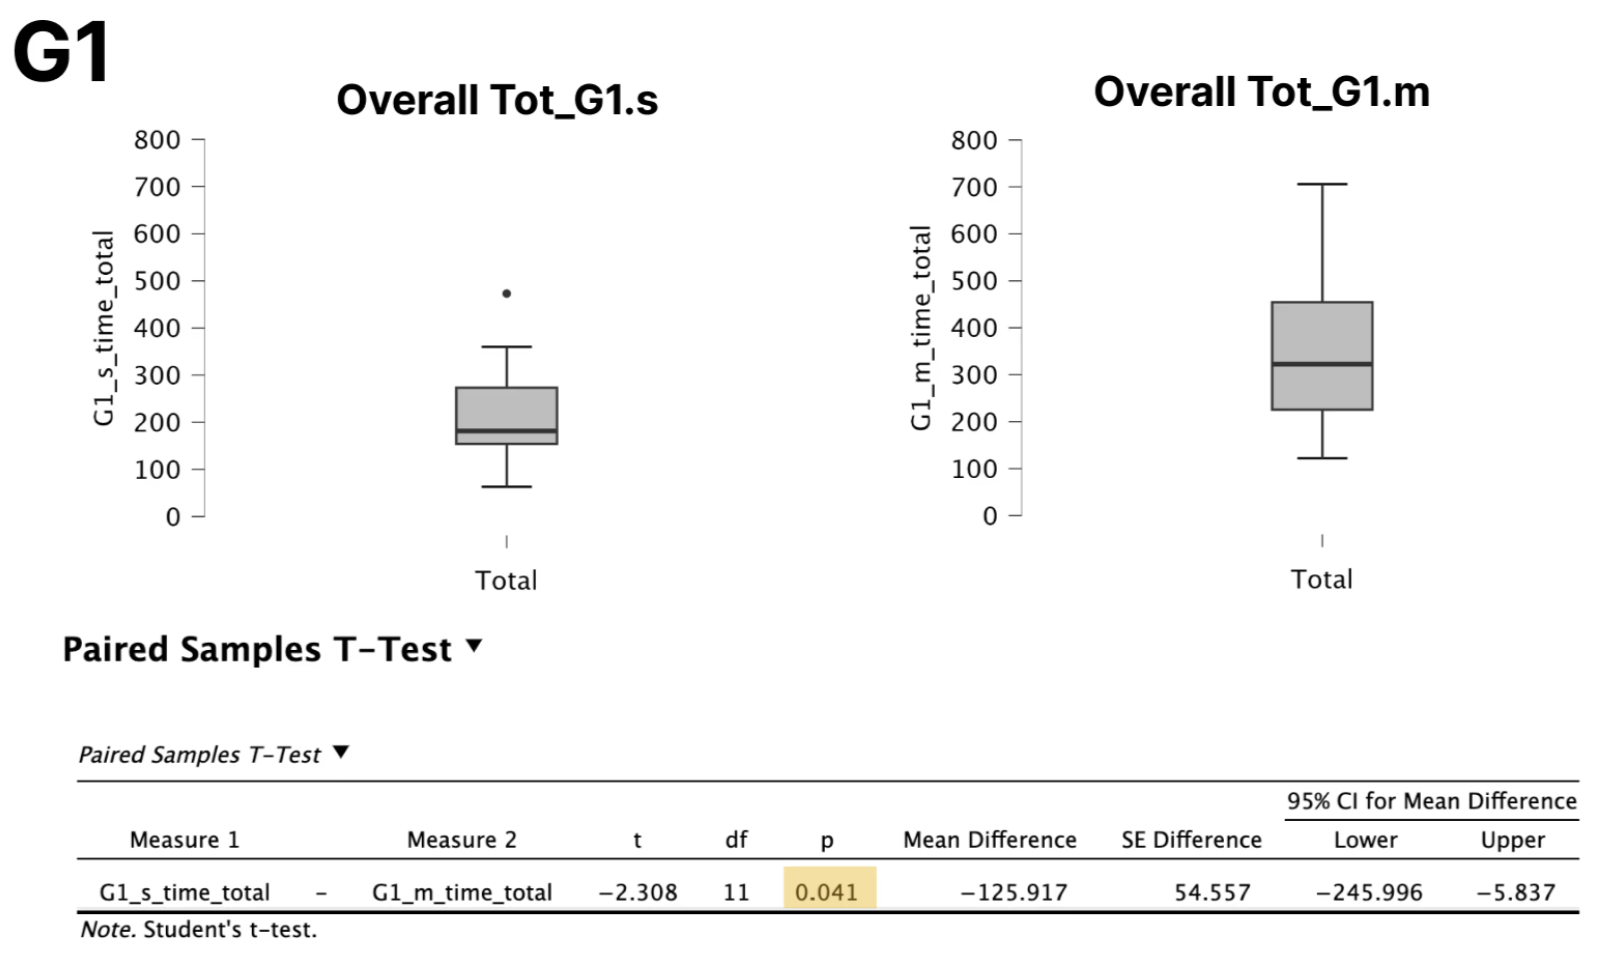
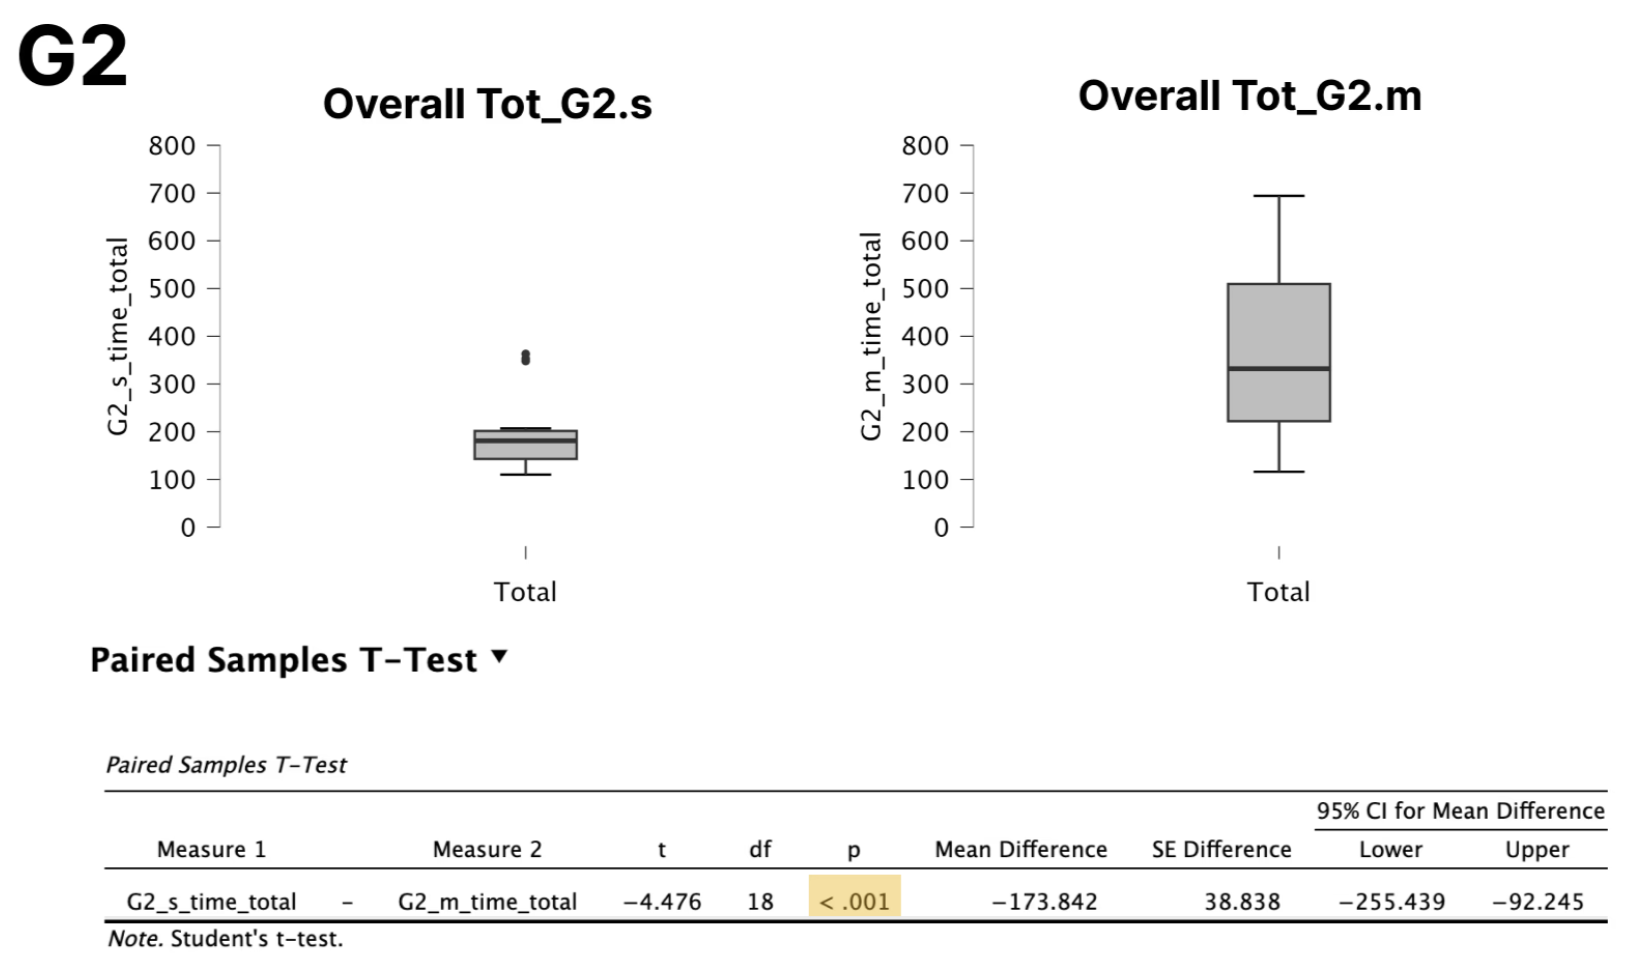
We conducted independent t-tests on TOT and SUS scores overall, then by group (G1, G2) and interface (S, M).
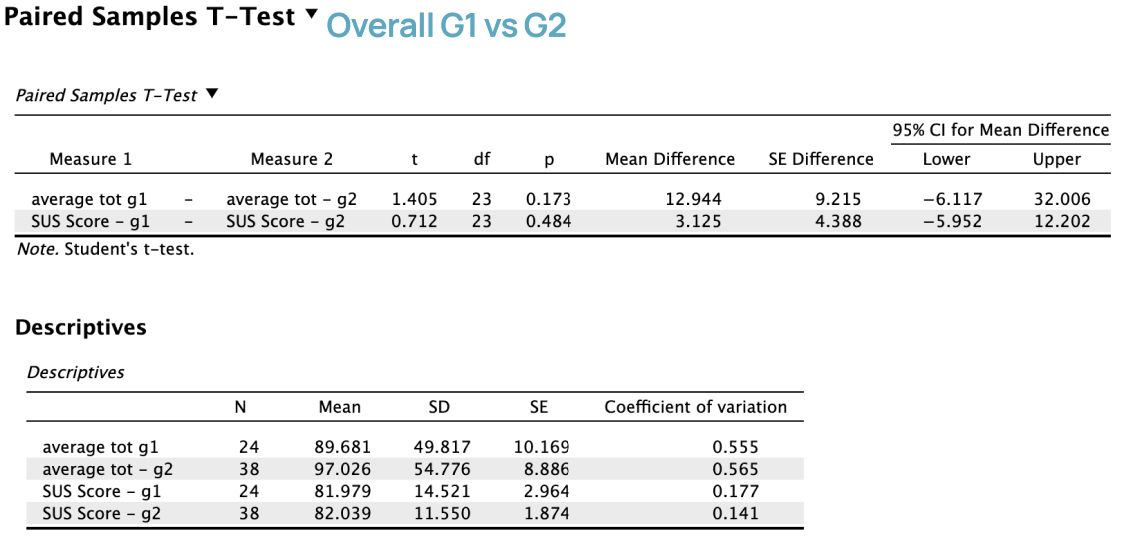
The multi-modality interface (M) received higher average SUS scores than the single-modality interface (S).
More experienced clinicians (Group 2) rated the multi-modality interface especially high in usability.
Less experienced clinicians (Group 1) showed smaller usability differences between interfaces.
Statistical tests did not reveal strong overall significance, but multiple analyses showed a consistent trend favoring the multi-modality interface.
Interpretation:
These results suggest that clinician experience level influences perceived usability, with more experienced users benefiting more from the multi-modality interface.
Q4. Is efficiency (TOT) affected by clinician experience?
After the t-test showed a significant Time on Task difference between interfaces S and M, we explored potential factors driving this efficiency gap.
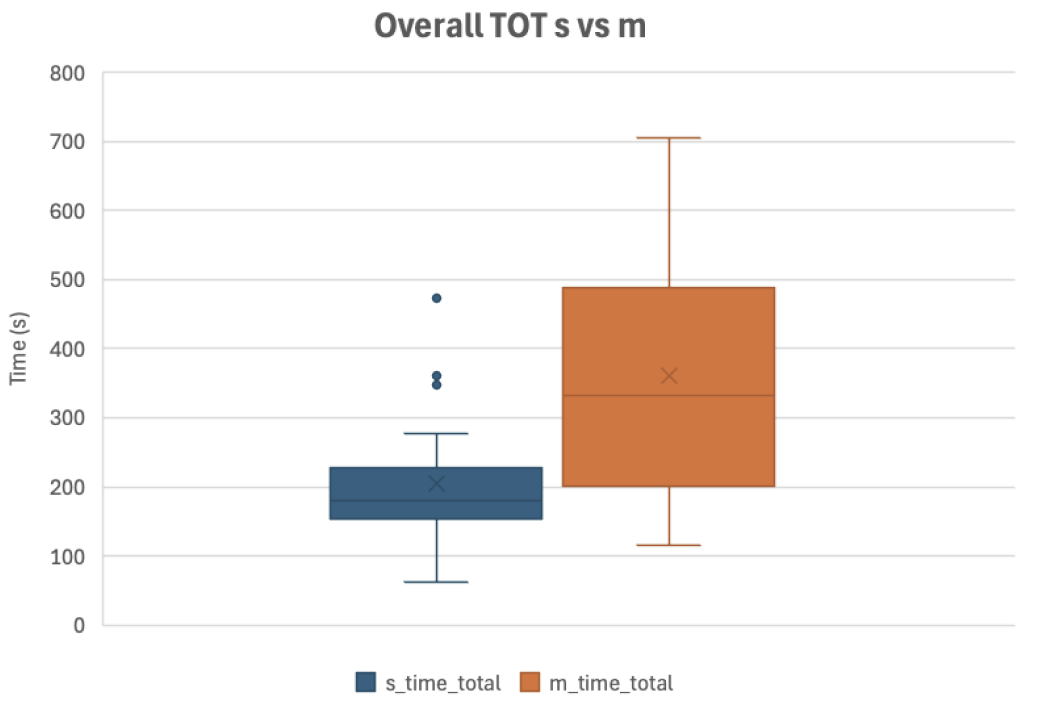
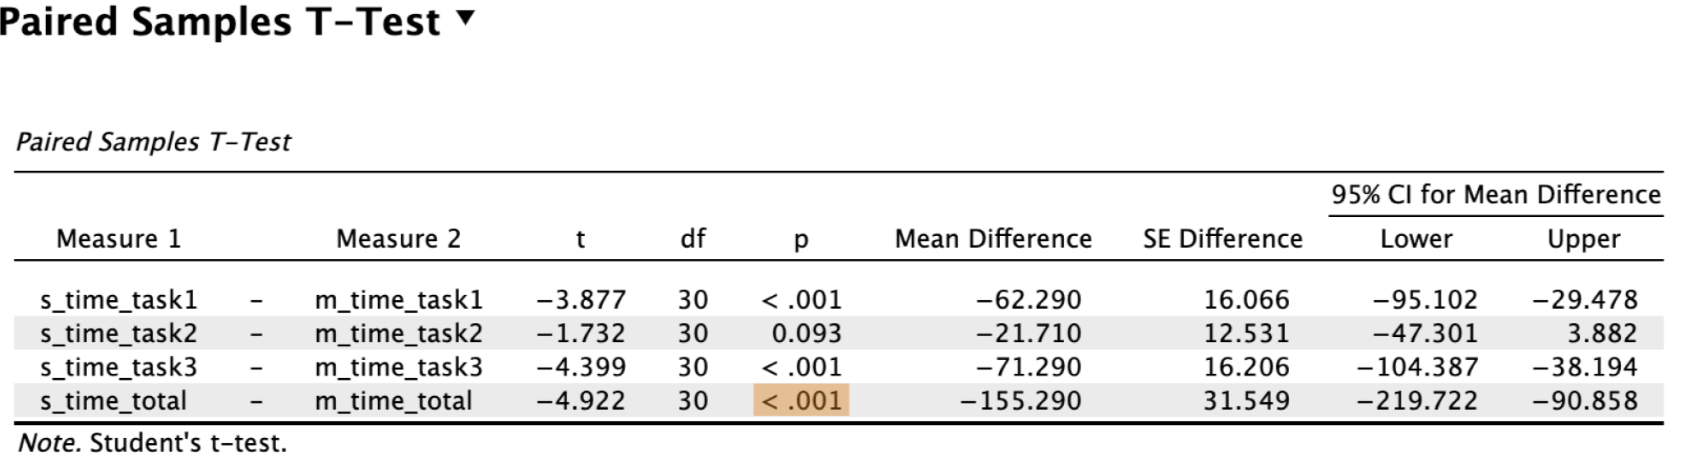
Paired comparisons showed that participants completed tasks significantly faster using the single-modality interface than the multi-modality interface.
This efficiency difference was consistent across most tasks and in overall time on task.
The results suggest that interface design played a meaningful role in task efficiency when users interacted with both systems.
Interpretation:
Interface design had a strong effect on task time, with the single-modality interface consistently outperforming the multi-modality interface in speed.
Q5. Is there a difference between these interfaces?
From looking at results of the tests we have shown so far, we can come to a conclusion about if there is a difference between interface S and M.
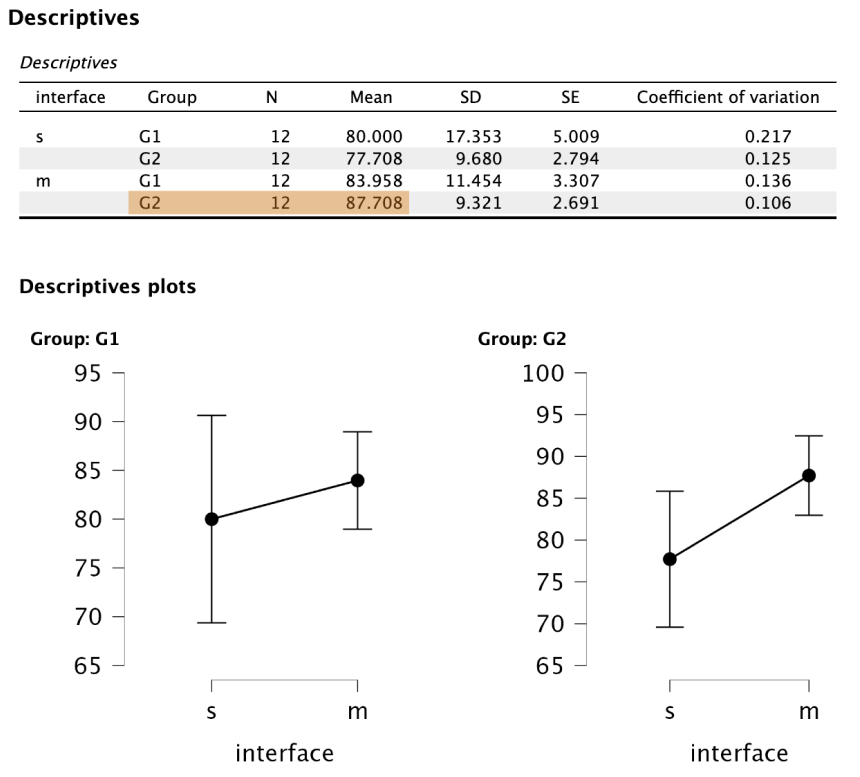
For both group 1 and group 2, users spent more time completing tasks on the multi-modality interface, which is reasonable since that interface presents more information.
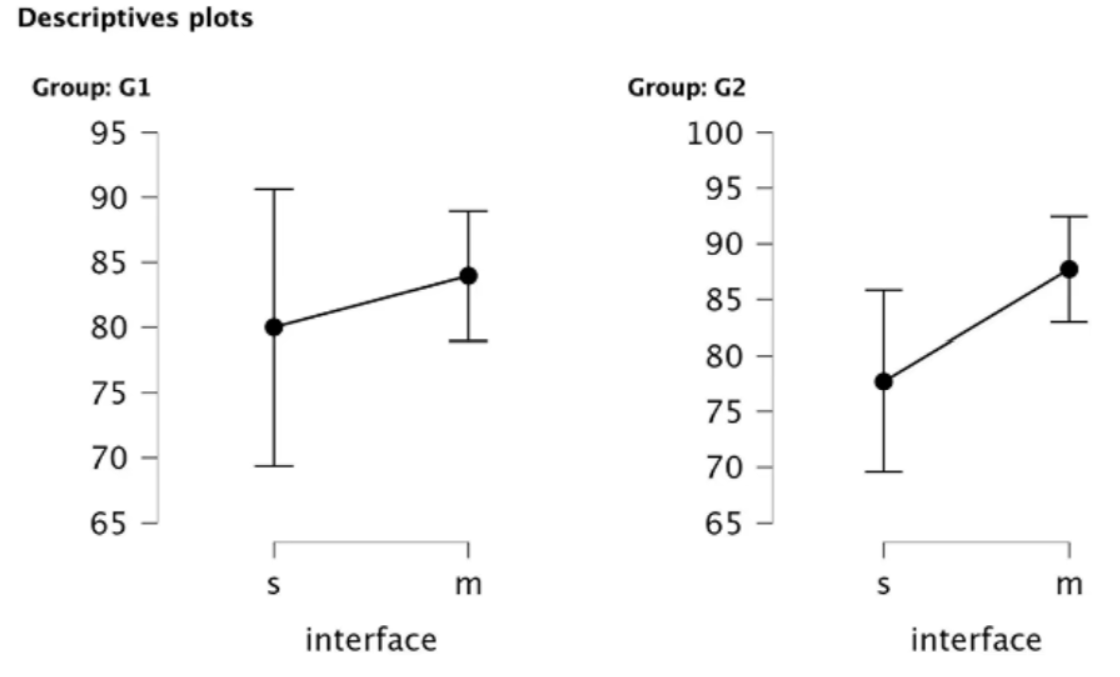
As shown in the descriptives plot, both junior and senior clinicians rated the multi-modality interface as more usable, suggesting that viewing multiple images simultaneously is valued in medical workflows.
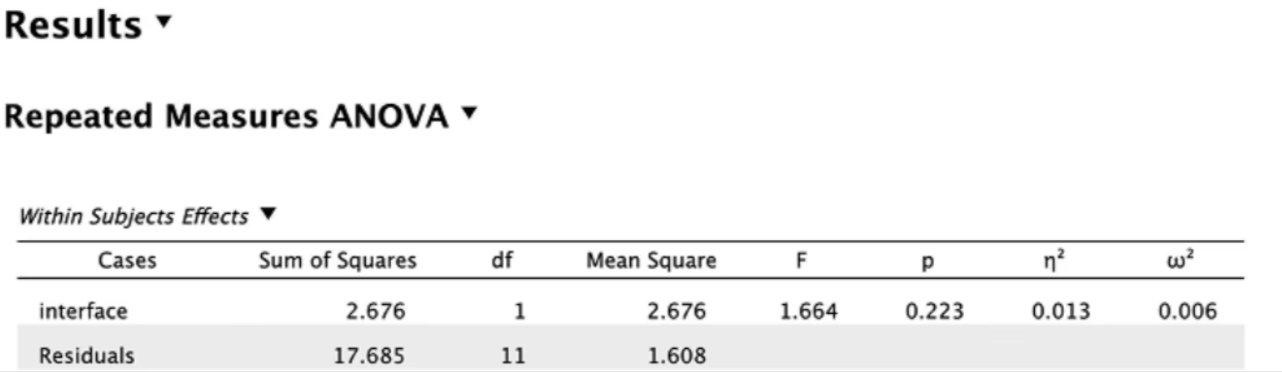
The overall perceived workload did not differ significantly between the 2 interfaces as shown by the previously described ANOVA results.
Interpretation:
Taken together, the findings indicate meaningful differences between the two interfaces. In medical contexts, efficiency may not be the only priority, and interfaces must also support complex workflows and provide comprehensive information.
Key Research Questions and Findings
Q1: How does workload differ by clinician experience?
Clinician experience influenced perceived workload, particularly for the multi-modality interface. Lower-level clinicians reported higher workload, while senior clinicians reported lower workload in this condition.
Q2: Are these variables related?
Less experienced clinicians (Group 1) consistently reported higher workload across both interfaces, indicating greater perceived task demand than Group 2.
Q3: Is one interface perceived as more usable overall?
The multi-modality interface was generally perceived as more usable, especially by experienced clinicians (Group 2).
Q4: Is efficiency affected by clinician experience?
Tasks were completed significantly faster using the single-modality interface, and this efficiency difference was consistent across experience levels.
Q5: How do the interfaces compare overall?
The multi-modality interface better supported complex workflows and comprehensive information but required longer interaction times. Despite this, experienced clinicians rated it as more usable and less cognitively demanding.
The findings show that both clinician experience and interface design shape perceptions of workload, usability, and efficiency. Less experienced clinicians experienced higher workload overall, while experienced clinicians benefited more from the multi-modality interface. Although the single-modality interface supported faster task completion, usability perceptions favored the multi-modality design, highlighting tradeoffs between efficiency and support for complex medical workflows.
Overall Recommendations and Learnings
Recommendation
Interface M is better suited for complex medical workflows where comprehensive information matters more than speed.
Follow-up qualitative research can clarify why users experienced higher temporal demand and lower performance.
Insights would help uncover underlying user pain points, add context to the quantitative results, and identify opportunities to refine the interface.
My Overall Learning:
This project showed me the importance of using multiple metrics to evaluate usability. While Interface M had a higher average time on task, it was perceived as more usable and less demanding by higher level clinicians, highlighting how relying on a single measure like time on task can lead to incomplete or misleading conclusions.